


ML Evaluation (ML Evals): The PM’s Survival Guide for Not Screwing Up AI Products
83% of PMs admit they prioritize deployment over evaluation, risking revenue, trust, and careers

1. Introduction: Beyond the Hype, Back to Basics🔑
You’ve undoubtedly observed the significant conversations surrounding generative AI recently, particularly about large language models (LLMs). This technology is here to reshape the future. In my previous blog post we dove deep into how to evaluate these shiny new tools.

But what about the other AI models quietly running the show behind your favorite apps?
Think of YouTube’s recommendation engine, hooking you with one video after the next, or Instagram’s feed, perfectly curated to keep you scrolling.
These systems aren’t necessarily powered by the GenAI hype. In many cases, they’re fueled by traditional Machine Learning (ML)—often more efficient and more transparent than their glitzier cousins.
But they still demand one critical step: rigorous evaluation.
Scenario: Your team deploys a "95% accurate" fraud detection model. One week post-launch:
→ Customer complaints surge by 200%
→ Revenue drops 15% in Southern states
→ The CEO’s inbox overflows with “Fix this now” emails Root cause? The model misclassified 38% of Texas transactions as fraudulent. Yourpromotion? Cancelled. Your reputation? “The PM who bankrupted the South.”
This is why ML evaluation isn’t optional – it’s career insurance.

ML evaluation is the process of measuring how well your ML model is performing, identifying its strengths and weaknesses, and ultimately ensuring it's delivering value to your users and your business.
ML evaluation is about more than just accuracy stats; it’s your direct line to understanding whether your model is truly moving the needle on user engagement, trust, and business goals.
Neglect this ‘missing piece,’ and you risk leaving real value on the table.
In a world obsessed with GenAI, let’s not overlook the nuts-and-bolts ML that’s quietly working behind the scenes.
This blog post will be your hands-on guide to mastering ML evaluation—so you can harness the power of these unsung heroes and build products that stand out.
Here, we’ll break down ML evaluation into simple, actionable insights:
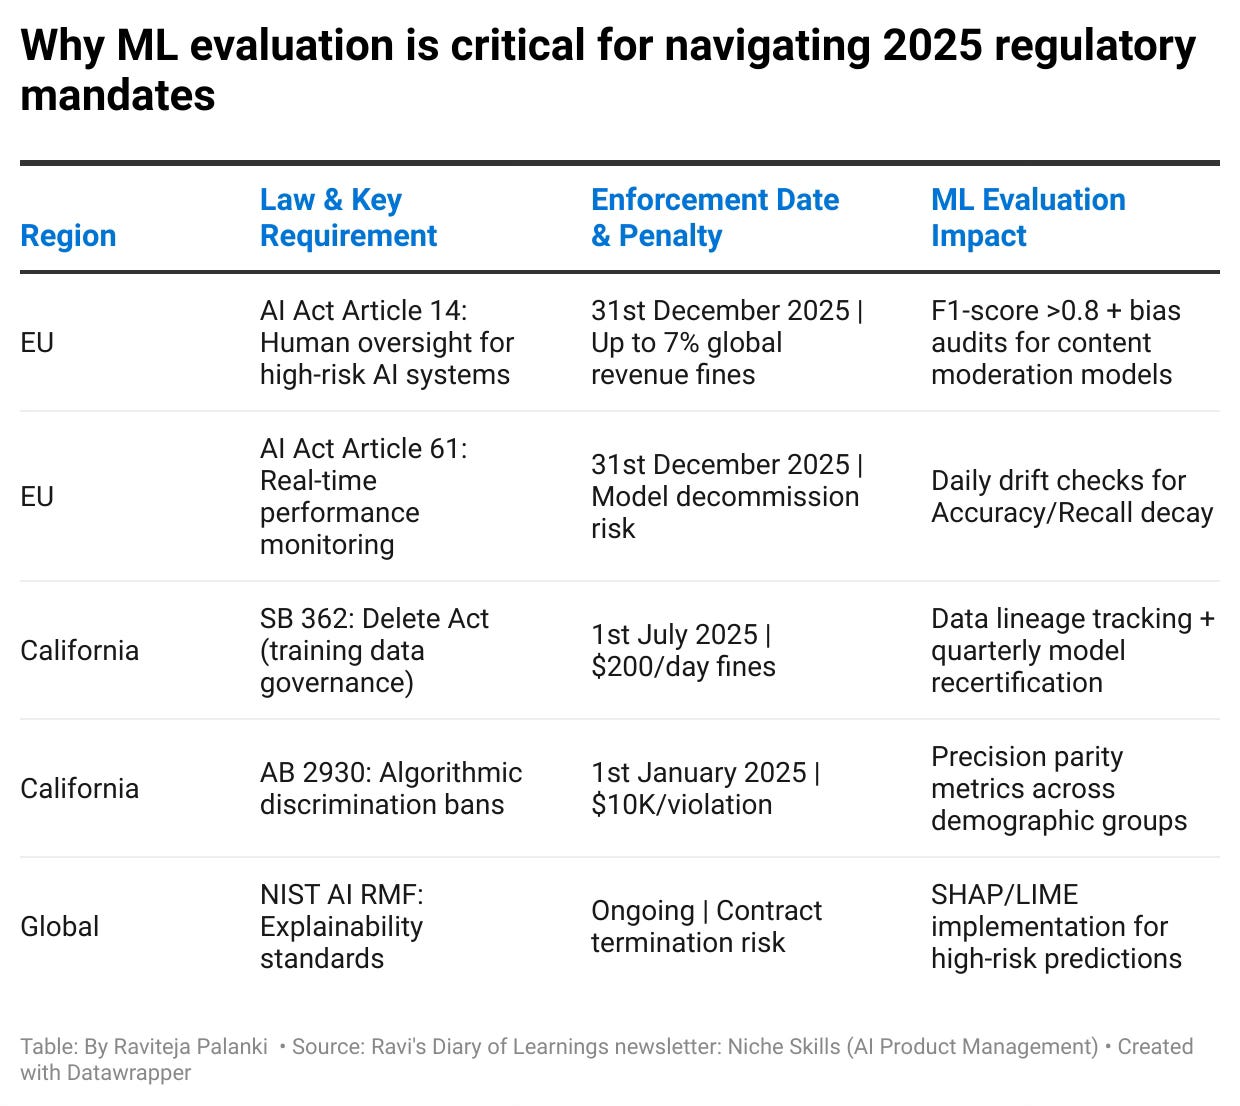
Why ML evaluation is critical? Understand 2025 regulatory mandates.
What classification and regression metrics are, explained simply.
How these metrics apply to real-world examples like YouTube and Instagram.
A step-by-step guide for product managers to evaluate ML models effectively.
Blind spots and challenges in ML evaluation you need to watch out for.
TL;DR – Key Takeaways of this post:
Measure & Manage: Use metrics to diagnose, optimize, and validate ML models.
Balanced Approach: Combine classification (precision, recall, F1, ROC-AUC) & regression (MAE, MSE/RMSE, R-squared) metrics for robust evaluation.
Business Alignment: Always tie metric outcomes to key business KPIs like user engagement, safety, and revenue growth.
Think of it this way:
GenAI is like a Swiss Army knife – incredibly versatile, but sometimes overkill for simple tasks.
Traditional ML is like a specialized tool – perfectly designed for a specific job, and often more efficient at it.
Knowing which tool to use, and how to measure its effectiveness, is crucial for any product manager.
Let's dive in deeper!
2. What is ML Evaluation? (And Why Should You Care?) 🤔
At its heart, ML evaluation asks a deceptively simple question: Is this model truly helping us reach our product and business goals?
Sure, you can build a model that ‘works,’ but without measuring how well it works—and where it falters—you’re flying blind.
Remember: What gets measured, gets managed—and what gets managed, gets improved.By continuously evaluating your ML model, you:
Spot Weaknesses Early: From inaccuracies to algorithmic bias, you know exactly where the model stumbles.
Optimize Performance: Fine-tune features, adjust thresholds, or improve fairness without guesswork.
Validate Return on Investment: See if it’s actually driving engagement, satisfaction, or other critical KPIs.
In short, ML evaluation is your real-time health check, steering you away from costly missteps and toward measurable success.
Why ML evaluation is critical for navigating 2025 regulatory mandates
3. Let’s Understand with some examples
For Example: Imagine you're the product manager for Instagram's Feed page. Your goal is to surface content that users will find engaging and relevant. You've built an ML model that predicts which posts a user is most likely to interact with. How do you know if it's working?You can't just rely on gut feelings or anecdotal evidence. You need tomeasurethe model's performance. You might track metrics like:
Engagement Rate: What percentage of users who see a recommended post actually like, comment, or share it?
Session Length: Do users spend more time on Instagram after interacting with recommendations from your model?
User Satisfaction: Are users reporting that they're finding more relevant and interesting content on the Explore page?
By analyzing these metrics, you can identify areas where your model is succeeding and areas where it needs improvement.
For Example: you might discover that your model is recommending too many posts from popular accounts and not enough from smaller creators. This could lead you to adjust your model to promote more diverse content.
Another Example: Think of a spam filter. If it's poorly evaluated, it might block important emails (false positives) or let spam through (false negatives), frustrating users.
Here's the bottom line for PM on Evals:
Ensuring Product Quality: Poorly performing models lead to bad user experiences, eroding trust and impacting adoption.
Data-Driven Decision Making: Metrics provide the evidence you need to justify investments, prioritize features, and iterate on your product.
Alignment with Business Goals: Evaluation helps you ensure the model is solving the right problem and contributing to key business objectives.
Risk Mitigation: Understanding model limitations allows you to identify potential biases, fairness issues, and unintended consequences.
Key Takeaway: Evaluating ML model performance is not just a technical exercise; it's a critical product management responsibility. It's an ongoing process that should be integrated into every stage of the product development lifecycle. It's the compass that guides you towards building ML-powered products that deliver real value.
🎯 Target: Focus on metrics aligned with business goals, not just chasing high scores on leaderboards.
4. The ML Evaluation Toolkit: Key Metrics Explained 🛠️
Now that we understand why ML evaluation is crucial, let's get our hands dirty with how to do it.
What Are Classification and Regression Metrics🤔
Understanding ML metrics starts with knowing the two main types of problems ML models solve: classification and regression. These terms might sound technical, but they’re surprisingly easy to grasp once you break them down.
Quick Analogy to Understand the Difference 🛠️
Imagine you’re a product manager for a car navigation app:
Classification is like deciding whether a route is “fast” or “slow” (categorizing).
Regression is like estimating the exact time it will take to reach your destination (predicting a number).
4.1 Classification Metrics: Sorting Things into Buckets 🗂️
Classification models answer yes/no or this/that questions. In other words, they predict which category something belongs to.
For Example:
On YouTube, a classification model might decide whether a comment is spam or not spam.
On Instagram, it might predict whether a post is appropriate or violates community guidelines.
To evaluate classification models, we use metrics that measure how well the model sorts items into the correct buckets:
Accuracy: How many predictions were correct overall?
Ideal for quick snapshots—but watch out for imbalanced classes.
Precision: Out of the flagged items, how many were actually correct?
Vital when false positives (wrongly flagged content) harm user trust.
Recall: Out of all the correct items, how many did the model flag?
Crucial if missing malicious content is a bigger risk.
F1-Score: A balanced lens combining both precision and recall.
ROC-AUC: How well the model distinguishes between categories overall.
Perfect for comparing models and picking optimal thresholds.
4.2 Regression Metrics: Predicting Numbers 📊
Regression models predict continuous values—think numbers on a scale.
For Example:
A regression model on YouTube might predict how many views a video will get.
On Instagram, it might estimate how many likes a post will receive.
To evaluate regression models, we use metrics that measure how close the model’s predictions are to the actual values:
Mean Absolute Error (MAE): The average difference between predicted and actual values.
Mean Squared Error (MSE): Like MAE, but penalizes large errors, helping you find big prediction misses.
Root Mean Squared Error (RMSE): The square root of MSE, making it easier to interpret.
R² (R-squared): How much of the variation in the data is explained by the model.
Shows what percentage of outcome variation your model actually explains.
The specific metrics you use will depend on the type of ML model you're evaluating and the goals you're trying to achieve. Example, As a product manager, link these metrics back to your core objectives. If user trust is paramount, hone in on precision to avoid false flags. If user safety is critical, focus on recall to catch every risky item.
Sometimes we also use the below
4.3 Ranking Models (Ordering Results)
Mean Average Precision (MAP): Measures the average precision across a set of ranked results.
Normalized Discounted Cumulative Gain (NDCG): Measures the ranking quality, giving higher weight to relevant items appearing higher in the results.
Real-World example: Consider a search engine. MAP and NDCG help evaluate how well the search engine ranks relevant results at the top of the page.
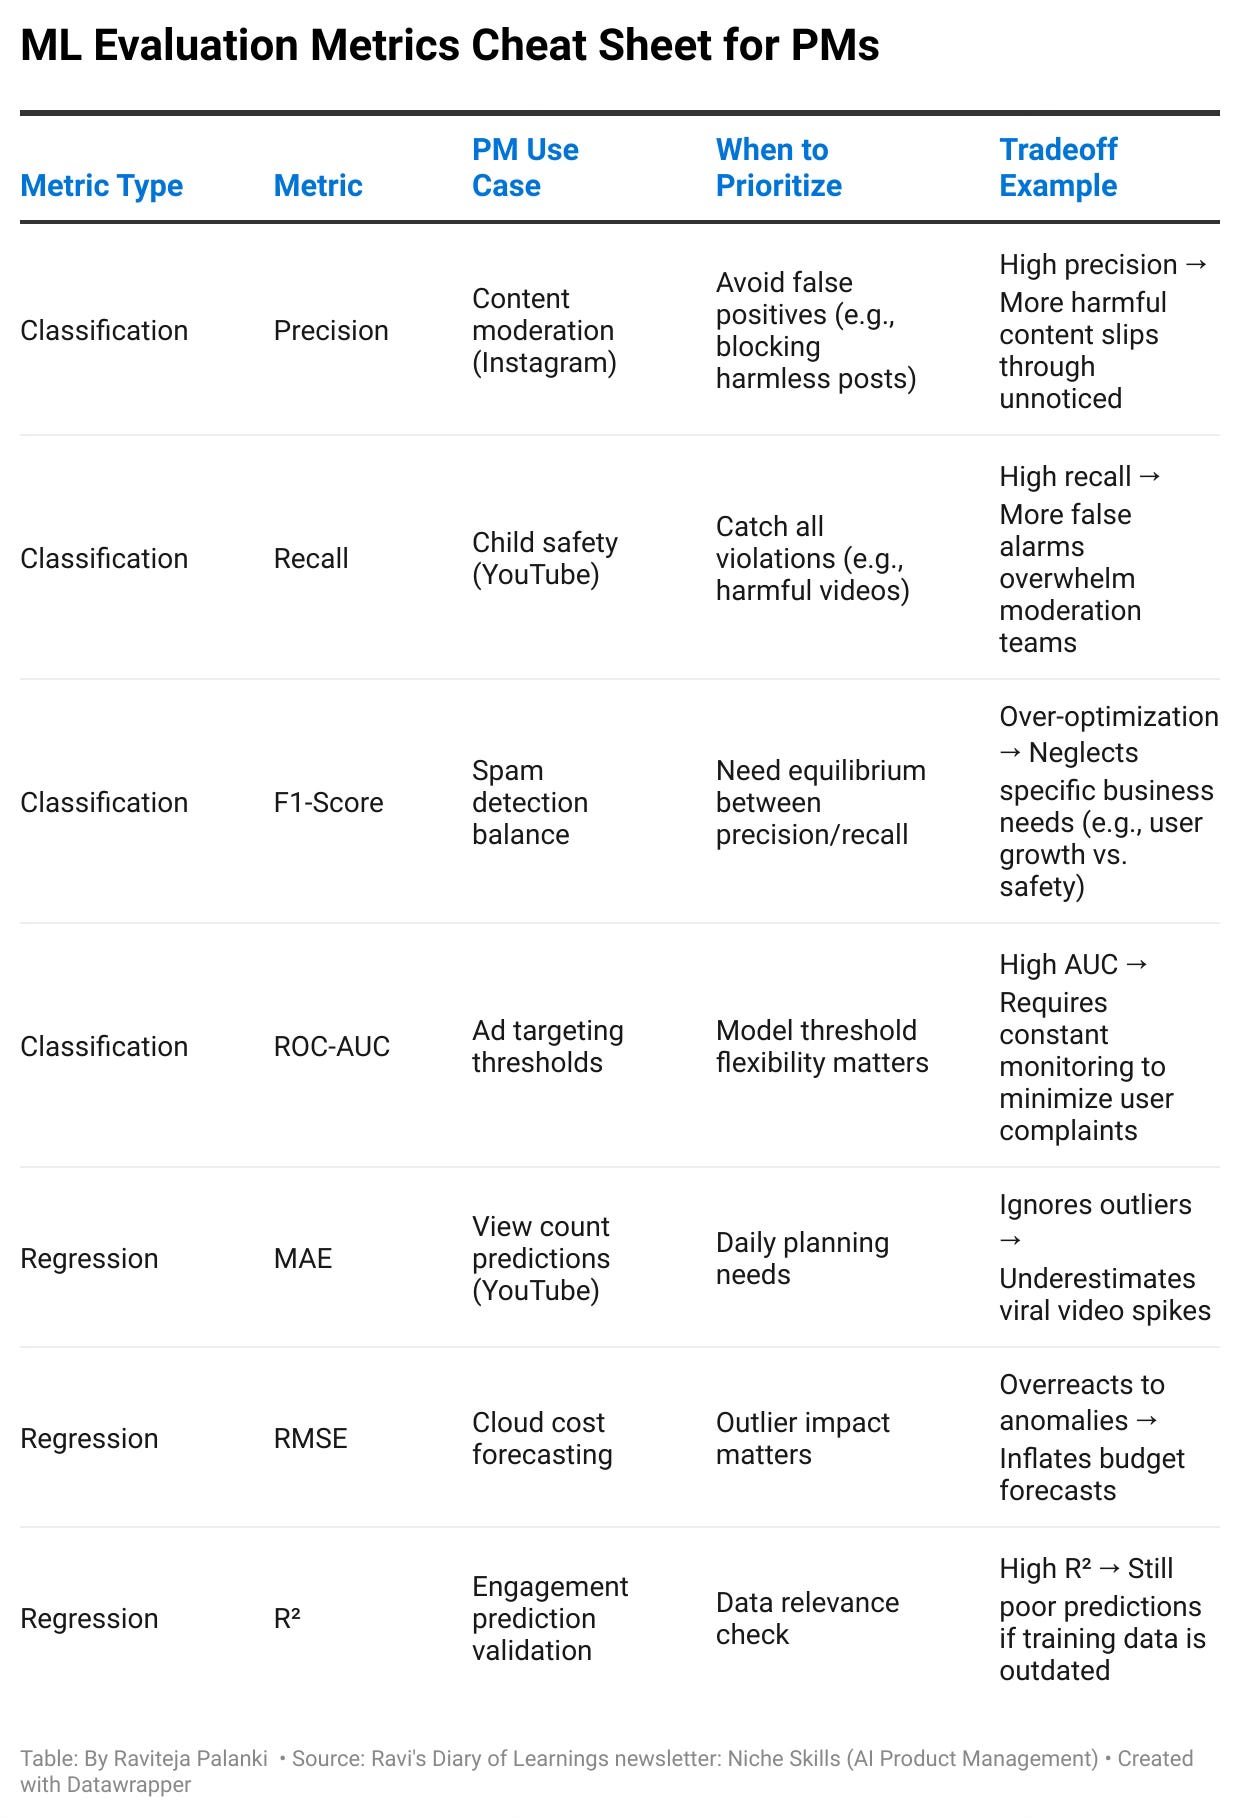
5. PM Cheat Sheet
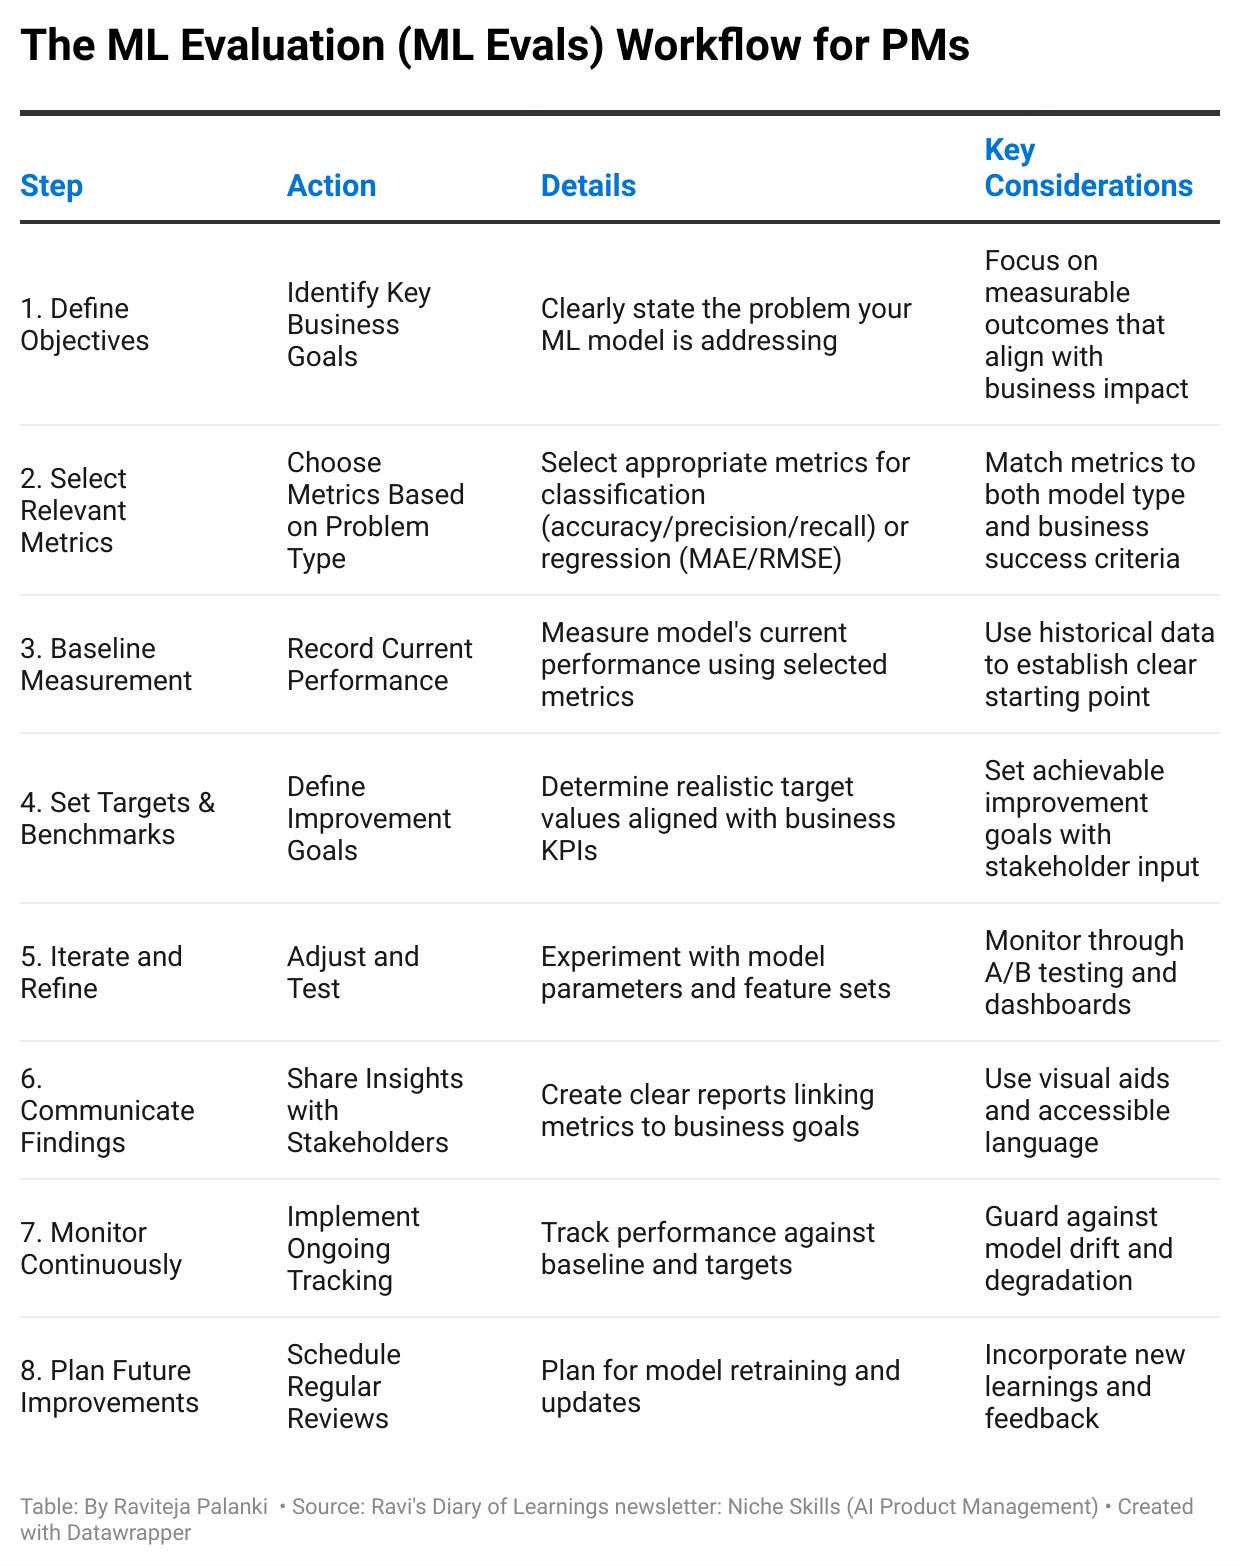
6. Step by Step Workflow for Evaluating ML Models
1. Define Objectives
Clarify the core problem you’re solving (e.g., boosting user engagement or reducing spam).
Decide exactly how you’ll measure success (click-through rates, session length, user reports, etc.).
2. Pick the Right Metrics
Classification? Weigh precision, recall, etc.
Regression? Consider MAE or RMSE.
Always align these choices with your specific product goals.
3. Establish Baseline & Targets
Capture your current performance metrics so you know where you stand.
Set improvement targets—tied directly to business KPIs—to guide your iteration
<90% recall? Automatic model quarantine.
5% false positives? Executive review required.
4. Rapid Iteration
Tweak features, training data, or thresholds based on results.
Run A/B tests or offline experiments to see what lifts your chosen metrics.
5. Continuous Tracking & Communication
Build real-time dashboards. Share progress with stakeholders.
If performance dips or user feedback flags issues, revisit steps 2–4.
Communicate for Impact
To engineers: “We need F1 >0.7 to avoid ops meltdown”
To CFO: “Every 1% recall gain = $450K risk reduction”
This cyclical approach keeps you nimble, ensuring your model remains an asset—not a liability—to your product’s success.
7. A Deep Dive into Classification Metrics 🗂️
Let’s explore the key metrics when your ML model is solving classification tasks.
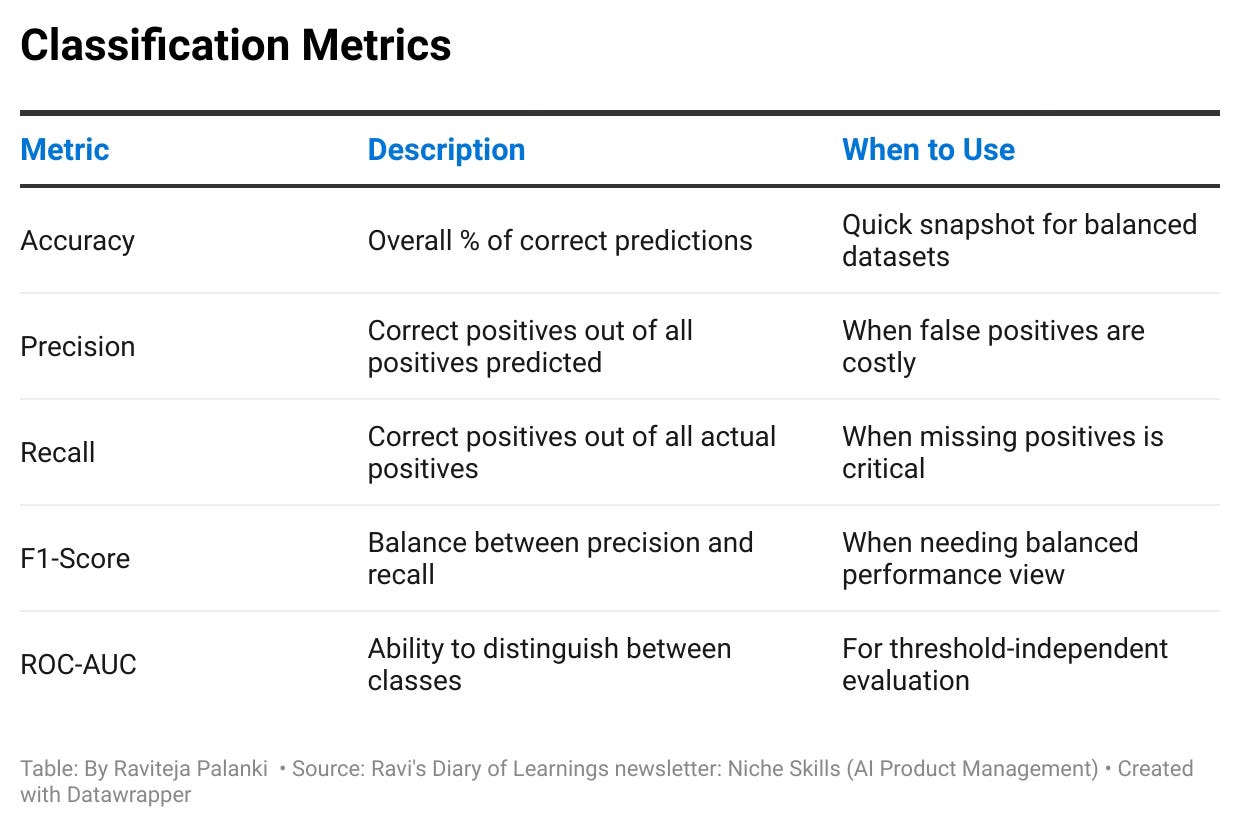
Accuracy
Definition: The ratio of correct predictions to total predictions.
Real-World Scenario: Consider YouTube’s system flagging misleading videos. A 90% accuracy means 90 out of 100 videos were correctly identified.
Blind Spot: In imbalanced datasets, a model labeling everything as “fine” can appear to have high accuracy, giving a false sense of security.
PM Mitigation Strategy: Pair accuracy with a per-class breakdown of errors. Investigate additional metrics (precision, recall) to ensure all classes—especially rare but critical ones—are adequately represented.
Precision
Definition: The ratio of true positives to all predicted positives.
Real-World Scenario: On Instagram, if your model flags posts as “sensitive,” precision tells you how many flagged posts truly deserved that label. High precision means fewer false alarms.
Blind Spot: Focusing on precision alone can neglect catching all harmful content (low recall). This can erode trust if users see dangerous posts slipping through.
PM Mitigation Strategy: Find a healthy balance with recall or F1-Score. Regularly evaluate the cost of false positives (user annoyance) versus false negatives (potential harm), and adjust thresholds accordingly.
Recall
Definition: The ratio of true positives to all actual positives.
Real-World Scenario: For YouTube’s content moderation, recall asks: “Of all harmful videos, how many are caught?” High recall reduces the risk of harmful content reaching users.
Blind Spot: A high recall but low precision can overwhelm moderators with false positives, leading to moderator fatigue and user complaints about over-censorship.
PM Mitigation Strategy: Balance recall with precision or F1-Score. Implement tiered moderation (e.g., auto-flag extreme cases, while borderline cases receive a secondary check).
F1-Score
Definition: The harmonic mean of precision and recall.
Real-World Scenario: On Instagram, F1-Score captures how well you’re balancing the need to catch harmful content without overburdening the system with false alarms.
Blind Spot: A single F1 number might hide whether precision or recall is the real culprit behind poor results. Nuances can get lost if you don’t separately track both.
PM Mitigation Strategy: Always look at the underlying precision-recall values. Use F1 for a quick overview, then dive deeper into the individual metrics to pinpoint the root cause of errors.
ROC-AUC
Definition: Measures a model’s ability to distinguish between classes across multiple thresholds.
Real-World Scenario: When YouTube fine-tunes moderation settings, a higher ROC-AUC indicates better discrimination between harmful and safe content before picking a specific threshold.
Blind Spot: ROC-AUC is threshold-independent; real-world scenarios demand a practical cutoff. A model with a high ROC-AUC can still underperform at the chosen threshold.
PM Mitigation Strategy: After comparing models with ROC-AUC, fine-tune the operating threshold using business-specific metrics (e.g., user trust impact, moderation effort) to match organizational goals.
Confusion Matrix
A confusion matrix is a table that visualizes the performance of a classification model. It shows the counts of true positives, true negatives, false positives, and false negatives.
It is extremely useful for measuring Recall, Precision, Specificity, Accuracy, and most importantly AUC-ROC curves.

True Positive (TP): Correctly predicted positive instances.
True Negative (TN): Correctly predicted negative instances.
False Positive (FP): Incorrectly predicted positive instances (Type I error).
False Negative (FN): Incorrectly predicted negative instances (Type II error).
I love this pregnancy analogy from this medium article:
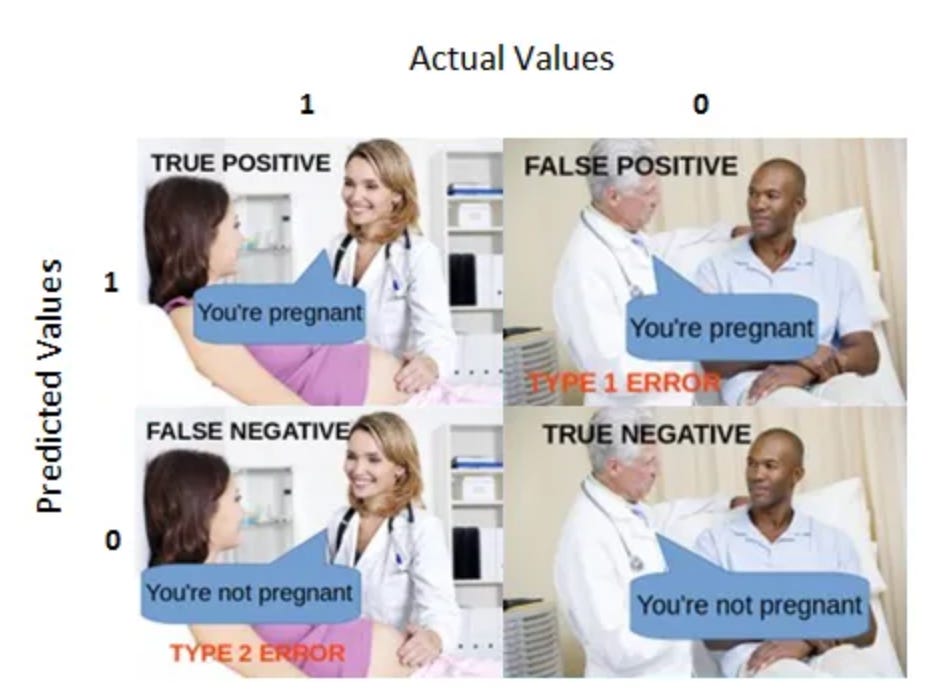
Type I: Test says pregnant when not (false hope).
Type II: Test misses pregnancy (missed reality)
Understanding the confusion matrix helps you diagnose where your model is making mistakes.
TL;DR:
Type I → Annoy users.
Type II → Destroy companies.
Choose your battle based on what your product can’t afford to lose.
Type I Error (False Positive)
When your model says "Yes" but should’ve said "No"
Dangerous When:
User Trust is Critical → Blocking safe posts/comments (e.g., Instagram wrongly flags a meme).
Revenue Relies on Transactions → Fraud filters mistakenly block real purchases (e.g., declined credit card).
Growth Phase → Over-filtering content slows engagement (e.g., new social app).
Example:
Spam filter marking a customer’s order confirmation as junk → Angry users, lost sales.
Type II Error (False Negative)
When your model says "No" but should’ve said "Yes"
Dangerous When:
Safety is Non-Negotiable → Harmful content slips through (e.g., YouTube misses violent videos).
Legal Risks Exist → Fraudulent transactions go undetected (e.g., stolen credit card charges).
Virality Could Backfire → Fake news spreads unchecked (e.g., election misinformation).
Example:
Fraud detector misses a $10K scam → Company loses money, reputation tanks.
Key Takeaway:
Understanding these metrics—and their trade-offs—is crucial. The right balance depends on the product’s priorities.
For instance, a content moderation system must favor recall to ensure harmful content is minimized, while a spam filter might lean on precision to avoid frustrating users.
8. Dissecting Regression Metrics: How Accurate Are Your Predictions? 📊
Regression tasks differ by forecasting continuous outcomes. Let’s look at how key regression metrics help you gauge performance.

Mean Absolute Error (MAE)
Definition
The average absolute difference between predicted values and actual outcomes.Real-World Scenario
For a YouTube model forecasting video view counts, MAE tells you, on average, how far off those predictions are. For instance, an MAE of 500 means your model is off by 500 views per video on average.Blind Spot
MAE treats all errors equally. This can mask the impact of large, sporadic errors (for example, when a video goes unexpectedly viral and your prediction is way off).PM Mitigation Strategy
Combine MAE with other metrics (like RMSE) to give you a fuller picture of outliers. Keep an eye on error distributions; a simple dashboard showing error ranges (small vs. huge misses) helps you see if occasional large errors need more attention.
Mean Squared Error (MSE) and Root Mean Squared Error (RMSE)
Definition (MSE)
The average of squared differences between predicted and actual values.Definition (RMSE)
The square root of MSE, translating error back into the same units as your target (e.g., view counts).Real-World Scenario
RMSE is especially handy when a few viral videos can dominate your data. For instance, a spike from a celebrity endorsement could cause huge discrepancies in predictions. A high RMSE signals your model struggles with these big swings.Blind Spot
MSE (and by extension RMSE) disproportionately penalizes large errors—potentially overemphasizing outliers if your data is skewed. This could lead to an overcorrection for edge cases at the expense of mainstream performance.PM Mitigation Strategy
Analyze outliers separately to decide if you need a specialized approach (e.g., a separate model for “viral” content). Compare MSE/RMSE to MAE to see if large errors drive most of your overall accuracy issues.
R-Squared
Definition
The proportion of variance in the target variable (e.g., likes, views) that your model explains. An R-squared of 0.85 implies the model accounts for 85% of the variability in outcomes.Real-World Scenario
For an Instagram like-prediction model, an R-squared of 0.85 means most fluctuations in likes are captured by your features—followers, hashtags, posting time, etc.Blind Spot
A high R-squared doesn’t guarantee useful predictions. It only measures how well your model explains historical variation, not how accurate the predictions are in practice.PM Mitigation Strategy
Combine R-squared with MAE or RMSE to gauge real-world predictive accuracy. If your model explains a lot of variance but still has a high error rate, refine your features or consider whether your target variable is truly being captured by the current data.
Key Takeaway:
Regression metrics provide a nuanced picture of accuracy.
Use MAE for simplicity and RMSE when larger errors are critical.
R-squared is essential to understand overall model fit, and all these metrics together inform decision-making.
Conclusion: Embrace the Metrics, Unlock the Future 🔑
Traditional ML may not hog the spotlight, but it’s the quiet force behind crucial parts of YouTube, Instagram, and countless other digital experiences. By rigorously evaluating these models, you’re not simply boosting accuracy—you’re driving user trust, deepening engagement, and securing measurable business success.
Remember:
Objectives & Metrics: A laser focus on what matters (e.g., user engagement, brand safety) ensures you choose the right metrics.
Iterative Improvements: Ongoing measurement and real-time testing transform “guesses” into data-driven gains.
Transparent Communication: Sharing clear insights builds trust internally and with your users.
In summary:
Master the Basics: Understand classification and regression metrics and their on-platform implications.
Turn Numbers into Strategy: Use these metrics not just for evaluation but as levers for informed product decisions (e.g., refining recommendations or improving moderation).
Challenge Assumptions: Continual monitoring and myth-busting keep your models honest and effective.
Future-Proof Your Product: Incorporate fairness, explainability, and flexible evaluation methods to stay ahead of evolving user and market demands.
Loving this? Check out my learning series for more such insightful posts
AI Product Management – Learn with Me Series

Welcome to my “AI Product Management – Learn with Me Series.”
shebang! no. Shabang.